


The largest cities in the US may not be what you expect. A few established metropolises in the northeast and Midwest regions have dominated the story over the past generations. However, driven by remote work, low cost of living, and a mild climate, the Sun Belt and the Mountain West are becoming new engines of urban growth, and a powerful population migration is reshaping the United States. To give you a comprehensive insight into this change, we have compiled a list of the biggest cities in the United States of America based on the latest population estimates from the U.S. Census Bureau. Read on with us to discover which cities have solidified their top three positions, which emerging cities have crossed the desirable threshold of a million residents, and more shifts and trends.
Top 10 Most Populated Cities in the US
To ensure accuracy and clarity, our list of the largest US cities focuses on the city proper population (the number of residents living within the official municipal boundaries), as defined by the nation’s most authoritative source. Based on the latest Vintage 2024 population estimates from the U.S. Census Bureau (data current as of July 1, 2024), the top 10 largest cities in the United States of America are:
1. New York City, New York
- Population 2024: 8,478,072
- Pop. Change Since 2020: 3.00% (Reflecting post-pandemic out-migration, though recent data shows recovery)
- Socioeconomic Data:
- Median Age: 37.6 years
- Median Household Income: ~$79,713
- Median Home Value: ~$763,358
- Nicknames: The Big Apple, Gotham, The City That Never Sleeps, Empire City.
- Key Landmarks: Statue of Liberty, Times Square, Central Park, Empire State Building, Brooklyn Bridge.
New York City is the undisputed biggest city in the United States of America, with a population of almost 8.48 million as of 2024. As the global center for finance, media, and culture, and the anchor of the largest Metropolitan Statistical Area (MSA) in the country, it attracts numerous returns of international migration after a period of population decline during the pandemic.

2. Los Angeles City, California
- Population 2024: 3,878,704
- Pop. Change Since 2020: -0.45% (Slight decline, but remains the anchor of a massive metro area)
- Socioeconomic Data:
- Median Age: 36.9 years
- Median Household Income: ~$80,366
- Median Home Value: ~$893,411
- Nicknames: The City of Angels, L.A., La-La Land, The Entertainment Capital of the World.
- Key Landmarks: Hollywood Sign, Griffith Observatory, Santa Monica Pier, Walt Disney Concert Hall.
Los Angeles has retained its position as the second-largest city in the United States of America for decades, with a highly diversified economy driven by international trade, technology, and the film industry, which is the entertainment capital of the world. Like many other major California cities, Los Angeles has experienced a slight population decline or stagnation in recent years.

3. Chicago City, Illinois
- Population 2024: 2,721,308
- Pop. Change Since 2020: -0.87% (Continues a trend of population loss, though the pace has slowed)
- Socioeconomic Data:
- Median Age: 35.6 years
- Median Household Income: ~$74,474
- Median Home Value: ~$362,500
- Nicknames: The Windy City, Chi-Town, The Second City, City of Big Shoulders.
- Key Landmarks: Millennium Park (The Bean), Willis Tower (Sears Tower), Navy Pier, Art Institute of Chicago.
Chicago holds its 3rd spot among the biggest cities in the US, but its position is increasingly challenged by rapidly growing Sun Belt cities like Houston. Historically, Chicago is the rail and industrial hub of the Midwest, and it remains a global financial center and a major transportation nexus. Since the 2020 Census, Chicago has consistently experienced population losses and often ranks among the cities with the largest numerical declines in the US, reflecting the North-to-South migration pattern.

4. Houston City, Texas
- Population 2024: 2,390,125
- Pop. Change Since 2020: +3.96% (Strong growth, narrowing the gap with Chicago)
- Socioeconomic Data:
- Median Age: 33.6 years (One of the youngest on the list)
- Median Household Income: ~$60,700
- Median Home Value: ~$245,000
- Nicknames: Space City, The Bayou City, H-Town, The Energy Capital of the World.
- Key Landmarks: Johnson Space Center, The Galleria, Museum District, Minute Maid Park.
As the largest city in Texas, Houston ranks as the 4th biggest city of the United States, a prime example of the Sun Belt’s dominance in population growth. Recognized as the “Energy Capital of the World“, Houston is home to the 2nd-most Fortune 500 Headquarters in the US and the world-renowned Texas Medical Center. In recent years, Houston has been adding tens of thousands of residents annually and often ranks among the top cities for population growth.

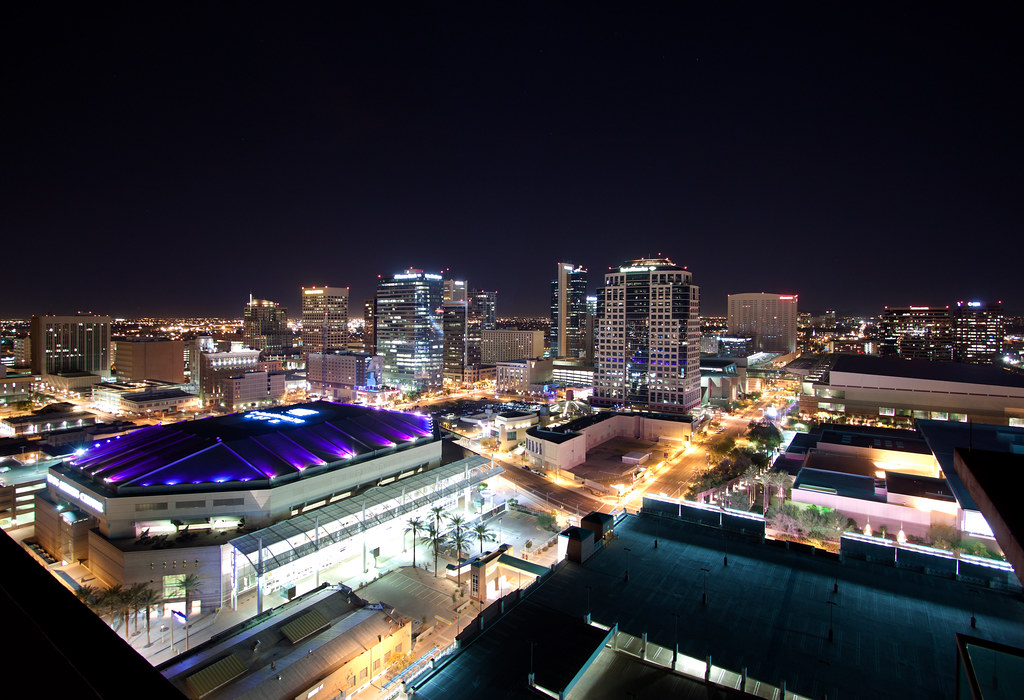
5. Phoenix City, Arizona
- Population 2024: 1,673,164
- Pop. Change Since 2020: +3.76% (Consistent, rapid growth as a Sun Belt destination)
- Socioeconomic Data:
- Median Age: 34.1 years
- Median Household Income: ~$69,000
- Median Home Value: ~$430,000
- Nicknames: The Valley of the Sun, Phx.
- Key Landmarks: Camelback Mountain, Heard Museum, Desert Botanical Garden, State Capitol.
Phoenix, the largest state capital in the US, ranks among the top 5 US cities by population as a key driver of the Mountain West’s explosive growth. It is becoming one of the fastest-growing large cities in the US, with a steady influx of residents drawn by its relative affordability and job market.
6. Philadelphia City, Pennsylvania
- Population 2024: 1,573,916
- Pop. Change Since 2020: -1.68% (Experiencing modest decline, but remains a vital Northeast hub)
- Socioeconomic Data:
- Median Age: 34.7 years
- Median Household Income: ~$56,000
- Median Home Value: ~$235,000
- Nicknames: Philly, The City of Brotherly Love, The Birthplace of America, The Quaker City.
- Key Landmarks: Liberty Bell, Independence Hall, Philadelphia Museum of Art (Rocky Steps), Reading Terminal Market.
Philadelphia remains in its place among the top 10 heaviest populated cities in the US, with a stable population and a modest recovery or slight growth after post-pandemic losses. Known as the “Birthplace of America,” it is a major center for education, with numerous universities, and a significant hub for healthcare and biotechnology.

7. San Antonio City, Texas
- Population 2024: 1,526,656
- Pop. Change Since 2020: +6.07% (The highest growth rate among the top 10, a Sun Belt powerhouse)
- Socioeconomic Data:
- Median Age: 34.4 years
- Median Household Income: ~$54,000 (Lowest income on the list, suggesting lower cost of living)
- Median Home Value: ~$220,000 (Lowest home value on the list, reinforcing affordability)
- Nicknames: Alamo City, River City, San Antone.
- Key Landmarks: The Alamo, San Antonio River Walk, Tower of the Americas, Mission San José.
Another fastest-growing city in Texas is San Antonio, which is also ranked among the United States of America’ largest cities due to a broader migration into the Texas Triangle. As the 2nd-largest city in Texas and the home of The Alamo, San Antonio’s economy is heavily supported by military bases, a growing cybersecurity industry, and tourism.

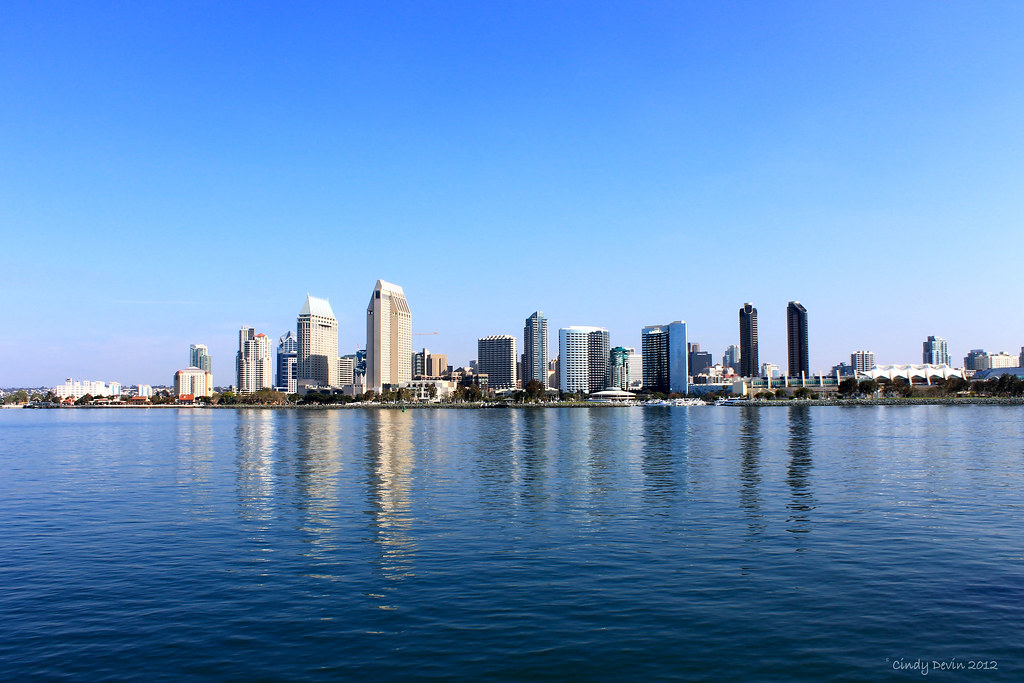
8. San Diego City, California
- Population 2024: 1,404,452
- Pop. Change Since 2020: +1.45% (Modest growth, maintaining its status as a high-cost, high-value city)
- Socioeconomic Data:
- Median Age: 35.7 years
- Median Household Income: ~$93,000 (Highest income on the list)
- Median Home Value: ~$875,000 (2nd highest home value)
- Nicknames: America’s Finest City, The Harbor of the Sun, City in Motion.
- Key Landmarks: Balboa Park, USS Midway Museum, San Diego Zoo, Old Town San Diego State Historic Park.
After Los Angeles, San Diego became the second California city to join the ranks of the major US cities. The city is a global leader in biotechnology and a major hub for the U.S. Navy and Marine Corps, giving it a unique economic profile. Although its city proper population growth has slowed, it remains a highly desirable and economically robust metro area.
9. Dallas City, Texas
- Population 2024: 1,326,087
- Pop. Change Since 2020: +1.74% (Solid growth, part of the nation’s fastest-growing metro area)
- Socioeconomic Data:
- Median Age: 33.7 years
- Median Household Income: ~$63,000
- Median Home Value: ~$310,000
- Nicknames: The Big D, D-Town, Triple D, The Metroplex (referring to the DFW area).
- Key Landmarks: Reunion Tower, Dealey Plaza, Dallas Museum of Art, Klyde Warren Park.
Dallas is the 3rd Texas city in the top 10 big cities in the US by population, and the central city of the rapidly expanding Dallas-Fort Worth (DFW) Metroplex. Dallas has long been a major inland port and a magnet for corporate headquarters, particularly in the financial services and technology sectors.

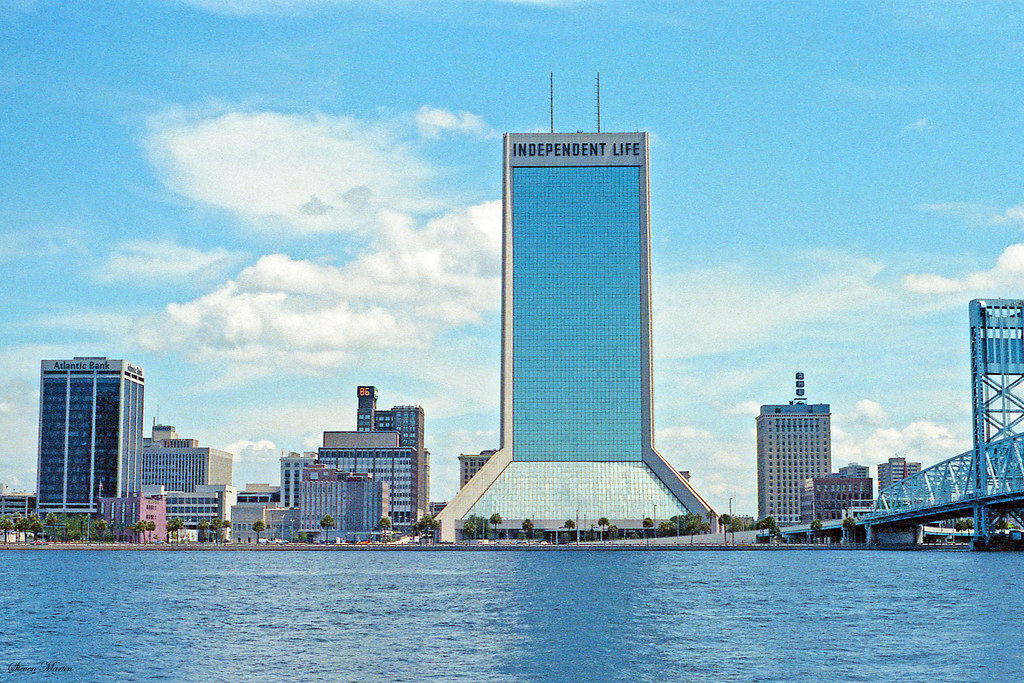
10. Jacksonville City, Florida
- Population 2024: 1,009,833
- Pop. Change Since 2020: +6.07% (Tied for the highest growth rate, officially crossing the 1 million mark)
- Socioeconomic Data:
- Median Age: 36.8 years
- Median Household Income: ~$61,000
- Median Home Value: ~$285,000
- Nicknames: Jax, The Bold City, J-Ville, River City (due to the St. Johns River).
- Key Landmarks: Friendship Fountain, TIAA Bank Field, Jacksonville Zoo and Gardens, Cummer Museum of Art and Gardens.
Jacksonville is the largest city by land area in the contiguous US and the only Florida city in the top 10 largest cities in America by city proper population. Its economy is dominated by the financial services, logistics (due to its major port), and military sectors. The rapid growth of the Florida Sun Belt contributes to that Jacksonville has recently crossed the 1 million population mark.
Top 100 Populous Cities in US
To give you a comprehensive view, we also listed the top 100 populous cities in the US based on U.S. Census Bureau (USCB) data and added more related information.
You will easily capture that older urban centers like New York, Chicago, and Philadelphia experienced net population outflows between 2020 and 2024, reflecting the effects of high housing costs and the remote work style after the pandemic. While almost all fast-growing cities lie in Texas and Florida, such as Frisco, TX (15.90%) and Cape Coral, FL (19.23%), are drawn by the low cost of living, favorable tax policies, and warmer climate.
| Top 100 Populous Cities in US (U.S. Census Bureau Data) | ||||||
|---|---|---|---|---|---|---|
| Rank | City | State | Population (2024 Estimate) |
Population (2020 Census) |
Pop Change (%) | Land Area (sq mi) |
| 1 | New York city | New York | 8,478,072 | 8,740,306 | -3.00% | 300.5 |
| 2 | Los Angeles city | California | 3,878,704 | 3,896,329 | -0.45% | 469.5 |
| 3 | Chicago city | Illinois | 2,721,308 | 2,745,196 | -0.87% | 227.7 |
| 4 | Houston city | Texas | 2,390,125 | 2,298,945 | 3.97% | 640.4 |
| 5 | Phoenix city | Arizona | 1,673,164 | 1,612,593 | 3.76% | 518 |
| 6 | Philadelphia city | Pennsylvania | 1,573,916 | 1,600,788 | -1.68% | 134.4 |
| 7 | San Antonio city | Texas | 1,526,656 | 1,439,340 | 6.07% | 498.8 |
| 8 | San Diego city | California | 1,404,452 | 1,384,824 | 1.42% | 325.9 |
| 9 | Dallas city | Texas | 1,326,087 | 1,303,426 | 1.74% | 339.6 |
| 10 | Jacksonville city | Florida | 1,009,833 | 951,925 | 6.08% | 747.3 |
| 11 | Fort Worth city | Texas | 1,008,106 | 923,645 | 9.14% | 347.3 |
| 12 | San Jose city | California | 997,368 | 1,009,686 | -1.22% | 178.3 |
| 13 | Austin city | Texas | 995,588 | 965,893 | 3.07% | 319.9 |
| 14 | Charlotte city | North Carolina | 943,476 | 887,484 | 6.31% | 308.3 |
| 15 | Columbus city | Ohio | 933,263 | 906,466 | 2.96% | 220 |
| 16 | Indianapolis city (balance) | Indiana | 891,484 | 887,213 | 0.48% | 361.6 |
| 17 | San Francisco city | California | 827,526 | 873,965 | -5.31% | 46.9 |
| 18 | Seattle city | Washington | 780,995 | 737,015 | 5.97% | 83.8 |
| 19 | Denver city | Colorado | 729,019 | 715,522 | 1.89% | 153.1 |
| 20 | Oklahoma City city | Oklahoma | 712,919 | 681,054 | 4.68% | 606.2 |
| 21 | Nashville-Davidson metropolitan government (balance) | Tennessee | 704,963 | 689,447 | 2.25% | 475.8 |
| 22 | Washington city | District of Columbia | 702,250 | 689,545 | 1.84% | 61.1 |
| 23 | El Paso city | Texas | 681,723 | 678,815 | 0.43% | 258.4 |
| 24 | Las Vegas city | Nevada | 678,922 | 641,903 | 5.77% | 141.8 |
| 25 | Boston city | Massachusetts | 673,458 | 675,647 | -0.32% | 48.3 |
| 26 | Portland city | Oregon | 635,749 | 652,503 | -2.57% | 133.5 |
| 27 | Louisville/Jefferson County metro government (balance) | Kentucky | 640,796 | 633,045 | 1.22% | 324.9 |
| 28 | Memphis city | Tennessee | 610,919 | 633,104 | -3.50% | 297 |
| 29 | Detroit city | Michigan | 645,705 | 639,111 | 1.03% | 138.7 |
| 30 | Baltimore city | Maryland | 568,271 | 585,708 | -2.98% | 80.9 |
| 31 | Milwaukee city | Wisconsin | 563,531 | 577,222 | -2.37% | 96.2 |
| 32 | Albuquerque city | New Mexico | 560,326 | 564,559 | -0.75% | 187.3 |
| 33 | Tucson city | Arizona | 554,013 | 542,629 | 2.10% | 241 |
| 34 | Fresno city | California | 550,105 | 542,107 | 1.48% | 115.2 |
| 35 | Sacramento city | California | 535,798 | 524,943 | 2.07% | 98.6 |
| 36 | Atlanta city | Georgia | 520,070 | 498,715 | 4.28% | 135.3 |
| 37 | Mesa city | Arizona | 517,151 | 505,950 | 2.21% | 133.1 |
| 38 | Kansas City city | Missouri | 516,032 | 508,096 | 1.56% | 317.9 |
| 39 | Raleigh city | North Carolina | 499,825 | 465,861 | 7.29% | 144.8 |
| 40 | Colorado Springs city | Colorado | 493,554 | 481,713 | 2.46% | 186.1 |
| 41 | Omaha city | Nebraska | 489,265 | 492,783 | -0.71% | 130.4 |
| 42 | Miami city | Florida | 487,014 | 442,828 | 9.98% | 35.8 |
| 43 | Virginia Beach city | Virginia | 454,808 | 459,673 | -1.06% | 249.2 |
| 44 | Long Beach city | California | 450,901 | 465,593 | -3.16% | 50.4 |
| 45 | Oakland city | California | 443,554 | 440,983 | 0.58% | 55.8 |
| 46 | Minneapolis city | Minnesota | 428,579 | 430,738 | -0.50% | 54 |
| 47 | Bakersfield city | California | 417,468 | 405,220 | 3.02% | 142.2 |
| 48 | Tulsa city | Oklahoma | 415,154 | 413,663 | 0.36% | 186.1 |
| 49 | Tampa city | Florida | 403,672 | 388,564 | 3.89% | 113.6 |
| 50 | Arlington city | Texas | 403,243 | 394,380 | 2.25% | 99.7 |
| 51 | Wichita city | Kansas | 400,991 | 398,067 | 0.73% | 161.7 |
| 52 | Cleveland city | Ohio | 363,379 | 371,853 | -2.28% | 77.7 |
| 53 | New Orleans city | Louisiana | 362,701 | 383,374 | -5.39% | 169.4 |
| 54 | Henderson city | Nevada | 350,039 | 318,660 | 9.85% | 104.7 |
| 55 | Urban Honolulu CDP | Hawaii | 344,967 | 348,442 | -1.00% | 60.5 |
| 56 | Anaheim city | California | 344,561 | 346,665 | -0.61% | 50.4 |
| 57 | Orlando city | Florida | 334,854 | 307,865 | 8.77% | 102.2 |
| 58 | Lexington-Fayette urban county government (balance) | Kentucky | 324,437 | 322,628 | 0.56% | 285.5 |
| 59 | Stockton city | California | 324,975 | 320,971 | 1.25% | 64.8 |
| 60 | Riverside city | California | 323,757 | 315,534 | 2.61% | 81.1 |
| 61 | Corpus Christi city | Texas | 317,317 | 318,285 | -0.30% | 154.6 |
| 62 | Newark city | New Jersey | 317,303 | 311,553 | 1.85% | 24.1 |
| 63 | Santa Ana city | California | 317,234 | 311,226 | 1.93% | 27.2 |
| 64 | Cincinnati city | Ohio | 314,915 | 309,604 | 1.72% | 77.9 |
| 65 | Pittsburgh city | Pennsylvania | 307,668 | 302,798 | 1.61% | 55.4 |
| 66 | St. Paul city | Minnesota | 307,465 | 311,127 | -1.18% | 52.1 |
| 67 | Greensboro city | North Carolina | 307,381 | 295,873 | 3.89% | 126.5 |
| 68 | Jersey City city | New Jersey | 302,824 | 291,960 | 3.72% | 14.8 |
| 69 | Durham city | North Carolina | 301,870 | 283,827 | 6.36% | 94.7 |
| 70 | Lincoln city | Nebraska | 300,619 | 291,333 | 3.19% | 92.2 |
| 71 | Las Vegas city | Nevada | 294,034 | 277,459 | 5.97% | 141.8 |
| 72 | Plano city | Texas | 293,286 | 286,422 | 2.40% | 71.6 |
| 73 | Anchorage municipality | Alaska | 288,790 | 290,905 | -0.73% | 1,704.70 |
| 74 | Gilbert town | Arizona | 288,660 | 269,429 | 7.14% | 68.7 |
| 75 | Madison city | Wisconsin | 285,300 | 274,667 | 3.87% | 78.6 |
| 76 | Reno city | Nevada | 281,714 | 264,146 | 6.65% | 105.9 |
| 77 | Chandler city | Arizona | 279,464 | 277,429 | 0.73% | 65.7 |
| 78 | St. Louis city | Missouri | 279,695 | 300,315 | -6.87% | 61.9 |
| 79 | Buffalo city | New York | 276,546 | 277,558 | -0.36% | 40.4 |
| 80 | Fort Wayne city | Indiana | 273,203 | 264,394 | 3.33% | 110.8 |
| 81 | Lubbock city | Texas | 272,086 | 258,050 | 5.44% | 121.7 |
| 82 | St. Petersburg city | Florida | 270,582 | 259,271 | 4.36% | 61.6 |
| 83 | Toledo city | Ohio | 265,638 | 270,285 | -1.72% | 80.7 |
| 84 | Laredo city | Texas | 261,260 | 255,495 | 2.26% | 91.5 |
| 85 | Port St. Lucie city | Florida | 258,575 | 206,828 | 25.02% | 115.8 |
| 86 | Glendale city | Arizona | 252,142 | 248,938 | 1.29% | 59.1 |
| 87 | Irving city | Texas | 255,769 | 256,907 | -0.44% | 67.5 |
| 88 | Winston-Salem city | North Carolina | 255,569 | 249,231 | 2.54% | 133.7 |
| 89 | Chesapeake city | Virginia | 254,997 | 249,726 | 2.11% | 340.3 |
| 90 | Garland city | Texas | 250,431 | 246,392 | 1.64% | 57.1 |
| 91 | Scottsdale city | Arizona | 246,236 | 241,868 | 1.81% | 184.4 |
| 92 | Boise City city | Idaho | 237,963 | 236,043 | 0.81% | 82.8 |
| 93 | Hialeah city | Florida | 235,288 | 222,418 | 5.79% | 22.8 |
| 94 | Frisco city | Texas | 235,208 | 202,764 | 16.00% | 62.4 |
| 95 | Richmond city | Virginia | 233,655 | 226,525 | 3.15% | 60 |
| 96 | Cape Coral city | Florida | 233,025 | 195,436 | 19.23% | 115.6 |
| 97 | Norfolk city | Virginia | 231,105 | 238,029 | -2.91% | 53.7 |
| 98 | Fayetteville city | North Carolina | 225,887 | 208,501 | 8.34% | 145.7 |
| 99 | Shreveport city | Louisiana | 183,983 | 187,595 | -1.93% | 123.1 |
| 100 | Mobile city | Alabama | 183,204 | 187,041 | -2.05% | 118 |
Understanding the Data: City Proper vs. Metro Area
When talking about the largest cities in the US, a common point of confusion lies in the distinction between “City Proper” and “Metropolitan Area”. Understanding the differences between the two is crucial for both researchers and readers, as they directly affect city rankings, economic influence, and the true face of population growth.
City Proper: Population within a City's Official Political Boundaries
City proper (also Incorporated Place), refers to the population located within the officially demarcated municipal boundaries. This is the statistical standard adopted by the main ranking list in this article.
- Focus: Only count the population residing within the geographical area under the jurisdiction of the municipal government.
- Ranking: It reflects the density and scale of a city’s core area and serves as a direct indicator of a city’s size in administrative and political terms.
- Limitation: This approach often underestimates the true scale of a city as an economic and cultural center. For instance, some cities (such as New York City) have expanded their municipal boundaries through mergers, while others (such as Boston or Miami) have maintained smaller core areas, with the majority of their population and economic activities scattered in the surrounding independent suburban cities.
Metropolitan Sratistical Area: True Measure of Economic & Cultural Influence
Metropolitan Statistical Areas (MSA) offer a broader and more functional perspective. The U.S. Census Bureau defines an MSA as a core city with a population of at least 50,000 and its highly socially and economically integrated surrounding counties (measured by commuting patterns).
- Focus: A metropolitan area is a functional region that regards the core city, suburbs, and commuter belts as a single economy.
- Ranking: The MSA population is generally regarded as the best indicator of a city’s overall market size, economic activity, and cultural influence. For example, when it comes to business site selection, real estate investment or assessing the labor market of a region, MSA data is more valuable for reference than City Proper data.
- Naming Convention: MSA is usually named after its core City, for example, “New York-Newark-Jersey City, NY-NJ-PA Metropolitan Statistical Area”.
Largest Metro Areas in US
Although our main rankings focus on the city’s main body, to provide a complete perspective and meet the search intent for “largest metropolitan area”, the following are the top 5 metropolitan statistical areas ranked using the latest 2024 estimated data from the U.S. Census Bureau. These figures reveal the scale of the true megacities in the United States.
| Rank | Metropolitan Area | 2024 Population Estimate |
|---|---|---|
| 1 | New York-Newark-Jersey City, NY-NJ | 19,726,871 |
| 2 | Los Angeles-Long Beach-Anaheim, CA | 12,886,400 |
| 3 | Chicago-Naperville-Elgin, IL-IN | 9,337,814 |
| 4 | Dallas-Fort Worth-Arlington, TX | 8,166,110 |
| 5 | Houston-The Woodlands-Sugar Land, TX | 7,617,700 |
Beyond Population: Largest US Cities by Land Area
Beyond population, people also sometimes measure major US cities by land area, and the results will be totally different from the ones we previously listed. Some cities with relatively small populations have risen to the top due to their vast geographical boundaries. Here is a list of the top 20 largest cities by land area in the US acccording to U.S. Census Bureau:
| Rank | City | State | Land area (square miles) | Land area (square kilometers) |
|---|---|---|---|---|
| 1 | Sitka | AK | 2,870.2 | 7,434 |
| 2 | Juneau | AK | 2,702.9 | 7,000 |
| 3 | Wrangell | AK | 2,556.1 | 6,620 |
| 4 | Anchorage | AK | 1,706.8 | 4,421 |
| 5 | Tribune | KS | 778.2 | 2,016 |
| 6 | Jacksonville | FL | 747.3 | 1,935 |
| 7 | Anaconda | MT | 736.7 | 1,908 |
| 8 | Butte | MT | 715.8 | 1,854 |
| 9 | Houston | TX | 640.8 | 1,660 |
| 10 | Oklahoma City | OK | 607.0 | 1,572 |
| 11 | Phoenix | AZ | 518.4 | 1,343 |
| 12 | San Antonio | TX | 499.0 | 1,292 |
| 13 | Nashville | TN | 475.6 | 1,232 |
| 14 | Los Angeles | CA | 470.5 | 1,219 |
| 15 | Statenville | GA | 420.4 | 1,089 |
| 16 | Suffolk | VA | 399.2 | 1,034 |
| 17 | Buckeye | AZ | 395.8 | 1,025 |
| 18 | Indianapolis | IN | 361.0 | 935 |
| 19 | Fort Worth | TX | 352.0 | 912 |
| 20 | Dallas | TX | 339.7 | 880 |
Many of the megacities on the list, especially those in Alaska and Montana, have adopted a consolidated county-city government structure. This means that the city’s administrative management and those of its surrounding counties (or boroughs in Alaska) are merged into a single entity.
Cities like Jacksonville (FL), Nashville (TN), and Indianapolis (IN) have also surpassed traditional large cities with larger populations, such as New York City (which ranks only 28th by land area), in terms of area by merging or expanding their municipal boundaries and incorporating a large number of suburban and even rural areas into the urban body.

Key Population Trends and Shifts
An in-depth analysis of the population data of the top 100 populous cities in US has revealed the significant transformation that the urban landscape is undergoing. The most core trend is the continuous rise of the “Sun Belt” and the relative decline of the traditional “Rust Belt” and coastal metropolises. These changes are not merely simple numerical increases or decreases; they reflect comprehensive shifts in economic, climate, and lifestyle preferences.
Sun Belt Growth: The fastest-growing cities are in the South and West, particularly in Texas, Florida, and Arizona, due to lower housing costs, warmer climates, and strong job markets.
Population Loss in Traditional Metropolises: Cities like New York, Chicago, and Los Angeles are seeing population decline or stagnation, partly due to high living costs and remote work trends.
Expansion of Texas Cities: Fort Worth, San Antonio, and Houston are experiencing significant growth, solidifying Texas as a key growth engine for U.S. cities.
Emerging Growth in North Carolina: Cities like Raleigh and Charlotte are seeing high growth rates, positioning North Carolina as a new growth hub on the East Coast.
Sun Belt’s Population Surge: Miami and Henderson, among other cities, experienced near double-digit growth between 2020-2024, reflecting strong migration to these states.
Decline in Coastal Metropolises: Cities like San Francisco and New York are facing population drops, reflecting the shift away from high-cost coastal regions.
Rust Belt Struggles: Cities like New Orleans and Cleveland are continuing to struggle with population loss, highlighting ongoing challenges in industrial centers.
Dynamic Million-Person Club: Fort Worth joins the “million-person” club in 2024, while San Jose loses its place, signalling changes in urban population dynamics post-pandemic.
Methodology and Data Source
- Primary Source: U.S. Census Bureau, Vintage 2024 Population Estimates (as of July 1, 2024).
- Ranking Basis: The rankings are based on the population estimates for the City Proper, which is the population residing within the official municipal boundaries.
- Annual Estimates (Used Here): The U.S. Census Bureau’s annual estimates are the official figures derived from models that track births, deaths, and migration between the decennial censuses. These are the most authoritative and current official numbers available.
- Decennial Census: The actual count of the population conducted every ten years (e.g., the 2020 Census), which serves as the base for all subsequent estimates.
Finding Your Place in the New Urban Landscape
The dynamic population shifts and rapid growth in cities like Fort Worth, Miami, and Raleigh underscore a critical challenge for new and existing residents: securing quality housing. Whether you are a student moving to a vibrant university town or a working professional relocating for a new opportunity, the demand for reliable and convenient accommodation in these major metropolitan areas is at an all-time high.
As you consider the next chapter in your life within these growing urban centers, finding the right place to live is paramount. uhomes.com specializes in connecting residents with a wide range of apartment rentals in United States, catering not only to the student community but also to professionals seeking premium housing in New York City and other major hubs. With a focus on modern amenities and prime locations across the country, uhomes.com simplifies the search for your perfect home in the nation’s most populous and fastest-growing cities.

Conclusion
From our list of the largest cities in the US, based on the latest 2024 data and 2025 projections by World Population Review, U.S. cities are seeing a shift towards the Sun Belt, with rapid growth in the South and West, particularly in Texas, Florida, and Arizona. These areas offer affordable housing, warmer climates, and strong job markets. On the other hand, cities in the Rust Belt and along the coast, such as New York and San Francisco, are experiencing population decline due to high costs and remote work trends.
In the coming years, this trend will continue, with the South and West leading in growth, while Northeast and Midwest cities will likely face ongoing challenges. New growth centers will emerge, especially in states like North Carolina and Nevada.
FAQ
What are top 10 largest cities in the United States of America?
The top 10 largest cities in the United States of America always include New York City, Los Angeles, and Chicago. These cities are the most populous in the country, with New York City having the highest population by far based on data from U.S. Cenus Bureau. Here is a brief list:
- New York City, New York – 8,478,072
- Los Angeles, California – 3,878,704
- Chicago, Illinois – 2,721,308
- Houston, Texas – 2,390,125
- Phoenix, Arizona – 1,673,164
- Philadelphia, Pennsylvania – 1,573,916
- San Antonio, Texas – 1,526,656
- San Diego, California – 1,404,452
- Dallas, Texas – 1,326,087
- Jacksonville, Florida – 1,009,833
What is the largest city in the United States?
The largest city in the United States is New York City, with a population of 8,478,072 based on data from U.S. Cenus Bureau. It significantly surpasses other cities in size and is a global hub for finance, culture, and commerce. New York City’s population is more than twice that of Los Angeles, the second-largest city.
What is the biggest city in America by land size?
The biggest city in America by land size is Sitka, Alaska, covering approximately 4,815 square miles. It is much larger than any other U.S. city, although its population is relatively small. The city’s vast land area is due to its location in a remote region of Alaska, encompassing many islands and natural areas.
What are the 10 largest metropolitan areas in North America?
The 10 largest metropolitan areas in North America include Mexico City, New York City, Los Angeles, Toronto, and Chicago. These cities are major economic and cultural hubs with large populations and significant global influence. Check the whole list:
- Mexico City, Mexico – Approximately 21.7 million people.
- New York City, USA – Around 19.9 million people.
- Los Angeles, USA – About 13.3 million people.
- Toronto, Canada – Approximately 6.7 million people.
- Chicago, USA – Around 9.5 million people.
- Dallas-Fort Worth, USA – About 7.7 million people.
- Houston, USA – Approximately 7.1 million people.
- Monterrey, Mexico – Around 5.8 million people.
- Vancouver, Canada – About 2.6 million people.
- San Francisco Bay Area, USA – Approximately 7.8 million people.
What is the total population of the United States?
As of 2025, the total population of the United States is estimated to be around 335 million people. This figure reflects steady growth, though at a slower pace in recent years due to factors like lower birth rates and immigration changes. The U.S. remains the third most populous country in the world, after China and India.
How many cities in the US have a population over 1 million?
As of 2025, there are 34 cities in the U.S. with populations over 1 million people (World Population Review). These include major cities like New York, Los Angeles, and Houston. Most of these large cities are concentrated in the South and West, reflecting recent population growth trends.
What is the fastest growing city in the US?
As of 2025, the fastest-growing city in the U.S. is Fort Worth, Texas, with a growth rate of nearly 10% over the past few years (World Population Review). This growth is driven by factors like affordable housing, a strong job market, and an influx of new residents. Other fast-growing cities include Phoenix and Charlotte, also experiencing significant population increases.
How does the biggest city in the U.S.A compare to the biggest city in the world?
New York City, with a population of about 8.5 million, is the largest U.S. city, while Tokyo’s metro area is the world’s largest, home to over 37 million people. Both cities are major financial hubs, but Tokyo has a significantly larger population and metro area. While New York has seen slower growth, Tokyo faces challenges due to Japan’s aging population.