Is the college you aspire to join also among the hardest colleges to get into? For thousands of students each year, applying to the hardest college to get into is a nagging decision. These universities where acceptance rates dip as low as 3-4%, turning admissions into a high-stakes competition. As college applications surge and elite institutions grow increasingly selective, understanding the landscape of the hardest colleges to get into can be a daunting decision.
In this guide, we’ll dissect the top 20 U.S. colleges with the lowest acceptance rates, from Ivy League giants like Harvard and Columbia to prestigious STEM powerhouses such as Caltech and MIT. But we’re not just listing names—you’ll discover why these schools are so competitive and how to strategically position yourself in the admissions race. Ready to see where your dream school ranks—and how to beat the odds? Let’s dive in.
Key Takeaways
- Minerva University, California Institute of Technology, and Harvard University are the hardest colleges to get into in the country.
- Admitted students typically hold top GPAs, near-perfect test scores, and strong leadership or community engagement experience.
- Acceptance rates at competitive colleges often sit between 1% and 9%.
How to Define the 'Hardest College to Get into'?
Defining the “hardest colleges to get into” is multifaceted and goes beyond a single metric, there are some important aspects:
The acceptance rate is calculated by dividing the number of admitted students by the total number of applicants. A college acceptance rate of less than 20% can be called a low acceptance rate. But there are also many Ivy League schools and other top institutions with acceptance rates that are even less than 10%. They are difinitely the hardest colleges to get in. The acceptance rate varies depending on whether you are applying for a “regular decision” or an “early decision.” In most cases, the acceptance rate of “early decision” is higher than that of “regular decision”. At the same time, the size of the school is also an important background basis for evaluating its acceptance rate. The acceptance rate reflects the rigor of the school’s screening, which also reflects the school’s teaching level and student quality to a certain extent.
At the same time, Academic Standards is an important factor. Highly selective colleges typically have stringent academic requirements, including: High GPA in rigorous coursework, Standardized Test Scores (SAT/ACT), and Class Rank. The nest aspects is Applicant Pool Quality and Volume: The sheer number of applications an institution receives and the qualifications of those applicants significantly impact selectivity. Highly desirable schools attract top students from around the world, making admission more competitive.

20 Hardest Colleges to Get Into Around the World
This section presents a ranked list of the 20 hardest colleges to get into based on their most recent available overall acceptance rates. The data prioritizes the Class of 2029 to ensure the most current representation of selectivity. Each entry provides key admissions statistics and a brief note on the institution’s unique aspects of selectivity.
| Top 20 Hardest Colleges by Overall Acceptance Rate | ||||
|---|---|---|---|---|
| Rank | College Name | Overall Acceptance Rate | Total Applicants | Total Accepted |
| 1 | Minerva University | 1% (2026) | 20,816 | 208 |
| 2 | California Institute of Technology | 2.27% (2028) | 13,863 | 315 |
| 3 | Harvard University | 3.6% (2028) | 54,008 | 1,970 |
| 4 | Yale University | 3.7% (2028) | 57,465 | 2,146 |
| 5 | Columbia University | 3.8% (2028) | 60,248 | 2,327 |
| 6 | Massachusetts Institute of Technology | 4.52% (2028) | 28,232 | 1,275 |
| 7 | Princeton University | 4.6% (2028) | 54,008 | 2,430 |
| 8 | Vanderbilt University | 5.1% (2028) | 47,171 | 2,401 |
| 9 | Brown University | 5.2% (2028) | 48,881 | 2,521 |
| 10 | Duke University | 5.2% (2028) | 54,191 | 2,790 |
| 11 | Northeastern University | 5.2% (2028) | 98,373 | 5,115 |
| 12 | Dartmouth College | 5.3% (2028) | 31,657 | 1,685 |
| 13 | University of Pennsylvania | 5.38% (2028) | 65,235 | 3,508 |
| 14 | Johns Hopkins University | 5.7% (2028) | 45,134 | 2,558 |
| 15 | Pomona College | 6.6% (2028) | 12,249 | 811 |
| 16 | Cornell University | 7.5% (2028) | 65,612 | 5,139 |
| 17 | Northwestern University | 7.5% (2028) | 50,000+ | 3,750 |
| 18 | Swarthmore College | 7.5% (2028) | 13,065 | 975 |
| 19 | Rice University | 7.75% (2029) | 36,777 | 2,852 |
| 20 | Amherst College | 9% (2028) | 13,743 | 1,238 |
Minerva University
- Overall Acceptance Rate: 1% (2022)
- Total Applicants (2022): 20,816; Total Accepted: 208
- Average Unweighted GPA: 3.7 (Middle 50%: 3.3-3.8)
- Middle 50% SAT Composite: 1450-1570
- Middle 50% ACT Composite: 33-35
Minerva University is the hardest college to get into. Its 1% acceptance rate stems from its innovative global curriculum and unique admissions process. It evaluates cognitive abilities through challenges and demonstrated achievements, rather than traditional tests or recommendations. This non-traditional model acts as a highly effective filter, attracting a self-selected pool of applicants who resonate with its immersive approach. Its extreme selectivity makes it arguably the hardest college to get into in the world, as it identifies a specific profile of future problem-solvers.
California Institute of Technology (Caltech)
- Overall Acceptance Rate: 2.27% (Class of 2028)
- Total Applicants (Class of 2028): 13,863; Total Accepted: 315
- Average Unweighted GPA: Approximately 4.2
- Middle 50% SAT Composite: 1530-1570
- Middle 50% ACT Composite: 35-36
Caltech, as the hardest college to get into, is renowned for its intensive STEM focus and unparalleled research opportunities, attracting a highly specialised applicant pool. Its rigour is underscored by its demanding core curriculum and the unique opportunity for undergraduates to engage in research alongside Nobel laureates. Caltech’s consistently low acceptance rate, often lower than Ivy League universities, makes it one of the hardest universities to get into. Its extreme specialisation in STEM fields drives intense competition, highlighting that selectivity extends beyond sheer popularity to encompass the depth of talent within a niche.
Harvard University
- Overall Acceptance Rate: 3.6% (Class of 2028)
- Total Applicants (Class of 2028): 54,008; Total Accepted: 1,970
- Average Unweighted GPA: 3.98 (Class of 2028 survey)
- Average SAT Composite: 1523 (Class of 2028 survey)
- Average ACT Composite: 34 (Class of 2028 survey)
As the hardest schools to get into and a globally recognised Ivy League institution, Harvard employs a comprehensive holistic review process, extending beyond academics to include community involvement, leadership, and personal qualities. It is worth mentioning that admitted students will have the opportunity to live in the highly academic Harvard University student accommodation. For example, the 1047 Commonwealth is a good choice. Harvard’s test-optional policy means these submitted scores might be higher than the true class average, as lower scores were likely withheld. This makes it one of the hardest colleges to get into, requiring exceptional overall profiles.
Yale University
- Overall Acceptance Rate: 3.7% (Class of 2028)
- Total Applicants (Class of 2028): 57,465; Total Accepted: 2,146
- Average Unweighted GPA: Estimated 4.18 (No minimum GPA )
- Middle 50% SAT Composite: 1500-1560
- Middle 50% ACT Composite: 34-36
Yale, a college with the lowest admission rate, is the most difficult to get into. It seeks students who will maximise its resources and contribute significantly to the community, emphasising academic ability and “outstanding public motivation”. “Everything matters” in their holistic review; successful applicants stand out through many small factors beyond high GPAs and test scores. The depth and authenticity of extracurriculars, essays, and recommendations are crucial differentiators. This makes Yale one of the most difficult colleges to get into, as applicants must craft a cohesive narrative showcasing character and intellectual curiosity. The scenery around Yale University is also quite beautiful. If you could study here, you’d easily find well-equipped Yale University student accommodations nearby with convenient transportation.
Columbia University
Overall Acceptance Rate: 3.8% (Class of 2028)
• Total Applicants (Class of 2028): 60,248; Total Accepted: 2,327
• Average Unweighted GPA: 4.15
• Middle 50% SAT Composite: 1520-1560
• Middle 50% ACT Composite: 34-36
Columbia is the hardest university to get into and also an Ivy League institution in New York City, using a holistic, contextual, and need-blind review. Admissions criteria emphasise academic preparation, intellectual curiosity, and individual voice. Its Manhattan location is key. Applicants demonstrating a desire to leverage urban opportunities and a “fit” for city life are favoured. This makes Columbia one of the hardest colleges to get into, as a demonstrated alignment with its urban setting and unique academic environment is a significant selection factor.
Massachusetts Institute of Technology (MIT)
- Overall Acceptance Rate: 4.52% (Class of 2028)
- Total Applicants (Class of 2028): 28,232; Total Accepted: 1,275
- Average Unweighted GPA: Approximately 4.0 (or very close), estimated 4.19
- Middle 50% SAT Composite: 1520-1570
- Middle 50% ACT Composite: 34-36
MIT, the most difficult college to get into, seeks students with a love for math, a passion for chemistry/physics, humanities appreciation, resilience, collaboration, creativity, determination, and an outlet for self-care. While a STEM powerhouse, MIT cultivates a well-rounded community, viewing the class as a “team”. This holistic approach values diverse perspectives for collaborative innovation. Its rigorous demands and comprehensive review make it one of the hardest universities to get into, implicitly favouring applicants with interests beyond pure academics.
Princeton University
- Overall Acceptance Rate: 4.6% (Class of 2028)
- Total Applicants (Class of 2028): 54008; Total Accepted: 2401
- Average Unweighted GPA: 4.2
- Middle 50% SAT Composite: 1530-1580
- Middle 50% ACT Composite: 34-35
Princeton is also one of the toughest colleges to get into, seeking “high-achieving, intellectually gifted students from diverse backgrounds” to “thrive in its rigorous academic environment”. Its test-optional policy for 2023-24 means reported SAT/ACT scores (Middle 50%) only reflect submitted scores. This can inflate averages, as lower scores were likely withheld. This situation highlights how test-optional policies can make it more challenging to gauge the true academic profile of the entire cohort, contributing to its status among the hardest colleges to get into.
Vanderbilt University
- Overall Acceptance Rate: 5.1% (Class of 2028)
- Total Applicants (Class of 2028): 47,171; Total Accepted: 2,401
- Average Unweighted GPA: 3.9 (for first-year students)
- Middle 50% SAT Composite: 1500-1560
- Middle 50% ACT Composite: 34-36
Vanderbilt has the lowest university acceptance rate, “New Ivy” recognised by Forbes for strong graduate job prospects. Its inclusion signifies a shift in perceived institutional value, driven by its ability to offer good job prospects. This suggests selectivity is increasingly influenced by return on investment and career outcomes, beyond historical prestige. Applicants prioritise strong post-graduation employment, making Vanderbilt one of the most difficult colleges to get into due to its growing appeal and competitive admissions.
Brown University
- Overall Acceptance Rate: 5.2% (Class of 2028)
- Total Applicants (Class of 2028): 48,881; Total Accepted: 2,521
- Average Unweighted GPA: 3.94
- Middle 50% SAT Composite: 1520-1570
- Middle 50% ACT Composite: 34-36
Brown is most difficult colleges to get into. It is distinguished by its “Open Curriculum,” allowing extensive academic exploration, and “The Brown Promise” financial aid. This unique curriculum attracts highly capable students prioritising intellectual autonomy, acting as a self-selection mechanism. This contributes to an exceptionally high-quality and competitive applicant pool, as self-directed students are drawn to this approach. Consequently, Brown remains among the hardest colleges to get into, as its distinctive academic model attracts a very specific and talented cohort.
Duke University
- Overall Acceptance Rate: 5.2% (Class of 2028)
- Total Applicants (Class of 2028): 54,191; Total Accepted: 2,790
- Average Unweighted GPA: Approximately 3.95
- Middle 50% SAT Composite: 1520-1570
- Middle 50% ACT Composite: 34-35
Duke is a hard school to get into. Its acceptance rate hit a historic low for the Class of 2028, reflecting its escalating popularity and rigorous selection criteria. Despite a substantial applicant pool, this low rate indicates increased desirability. Its “global appeal” and surge in early applications show Duke attracts a broader, more competitive international applicant base. This influx of highly qualified candidates significantly intensifies competition, solidifying Duke’s position as the hardest university to get into.
Northeastern University
- Overall Acceptance Rate: 5.2% (Class of 2028)
- Total Applicants (Class of 2028): 98,373; Total Accepted: 5,115
- Average High School GPA: 4.3
- Middle 50% SAT Composite: 1460-1530
- Middle 50% ACT Composite: 33-34
Northeastern’s acceptance rate has dramatically declined, attributed to its “unique ‘brand’” and global campus system. As a test-optional institution , its prominent co-op program is a major draw. The substantial drop in its acceptance rate (from 18% to 6.8% in one year) and nearly 100,000 applications indicate that practical, career-oriented learning models are highly appealing. This drives up application volume, making Northeastern one of the hardest colleges to get into.
Dartmouth College
- Overall Acceptance Rate: 5.3% (Class of 2028)
- Total Applicants (Class of 2028): 31,657; Total Accepted: 1,685
- Average Unweighted GPA: Estimated 4.11
- Middle 50% SAT Composite: 1450-1550
- Middle 50% ACT Composite: 33-34
As top 20 hardest colleges to get into, Dartmouth upholds rigorous academic standards. Its early decision process is binding, offering a statistically higher acceptance rate compared to its regular decision round. The significant disparity between Dartmouth’s Early Decision (ED) acceptance rate (17.1%) and Regular Decision (RD) rate (3.6%) highlights a clear “commitment premium.” This implies that for students with a definitive top-choice university, applying ED can be a highly strategic manoeuvre, substantially increasing their individual odds of admission.
University of Pennsylvania (UPenn)
- Overall Acceptance Rate: 5.38% (Class of 2028)
- Total Applicants (Class of 2028): 65,235; Total Accepted: 3,508
- Average Unweighted GPA: 4.15
- Middle 50% SAT Composite: 1500-1560
- Middle 50% ACT Composite: 34-35
UPenn is also included top hardest colleges to get into. Known for its strong business school (Wharton), it is highly competitive, filling much of its class via Early Decision. As one of only two Ivy League undergraduate business schools, it attracts a large, ambitious pool of business-focused applicants. This distinctive offering contributes to its low acceptance rate. Specialised, top-tier programs significantly drive up institutional selectivity, making UPenn one of the most difficult colleges to get into due to its dedicated and competitive applicant subset.
Johns Hopkins University
- Overall Acceptance Rate: 5.7% (Class of 2028)
- Total Applicants (Class of 2028): 45,134; Total Accepted: 2,558
- Average Unweighted GPA: 3.95
- Middle 50% SAT Composite: 1530-1570
- Middle 50% ACT Composite: 34-36
Johns Hopkins is hardest colleges to get into and a leading research university, particularly strong in medicine and health sciences. Its acceptance rate has significantly declined, reflecting increasing competition. The high percentage of admitted students with high school jobs/internships or civic engagement suggests that demonstrated engagement in research or impactful projects related to their academic interests is a significant factor. Applicants showcasing hands-on experience and a proactive approach will possess a competitive advantage.

Pomona College
- Overall Acceptance Rate: 6.6% (Class of 2028)
- Total Applicants (Class of 2028): 12,249; Total Accepted: 811
- Average Unweighted GPA: Estimated 4.05
- Middle 50% SAT Composite: 1480-1550
- Middle 50% ACT Composite: 33-34
Pomona is recognised as one of the hardest schools to get into and the nation’s premier liberal arts college, maintaining a highly competitive admissions process with a consistent acceptance rate aof round 7% since 2019. Its low acceptance rate, comparable to many larger research universities, underscores the intense competition prevalent within top-tier liberal arts colleges. This suggests that while these institutions may not attract the sheer volume of applicants seen at larger universities, the quality of their applicant pool is exceptionally high.
Northwestern University
- Overall Acceptance Rate: 7.5% (Class of 2028)
- Total Applicants (Class of 2028): 50,000+; Total Accepted: 3,750
- Average Unweighted GPA: Estimated 4.17
- Middle 50% SAT Composite: 1500-1560
- Middle 50% ACT Composite: 33-34
Northwestern has the lowest admission rate among colleges. The university emphasises a holistic review and offers a binding Early Decision option, which accounts for a significant portion of its incoming class. Northwestern notably enrols “approximately 50% of our incoming freshman class from early decision”. This high percentage of Early Decision (ED) admits indicates that a substantial portion of their class is filled before the Regular Decision (RD) round even begins.
Swarthmore College
- Overall Acceptance Rate: 7.5% (Class of 2028)
- Total Applicants (Class of 2028): 13,065; Total Accepted: 975
- Average Unweighted GPA: Estimated 4.09
- Middle 50% SAT Composite: 1480-1540
- Middle 50% ACT Composite: 33-34
Swarthmore interprets what the hardest colleges to get into are. It is a highly selective liberal arts college that uniquely offers an engineering program. Its admissions rate has consistently remained in the single digits. This unique combination likely attracts a distinct group of applicants who seek both the breadth of a liberal arts education and the specialised technical training typically found in engineering programs. This indicates that institutions offering interdisciplinary or hybrid programs can carve out a unique niche, thereby attracting a highly competitive applicant pool.
Cornell University
- Overall Acceptance Rate: 7.5% (Class of 2028)
- Total Applicants (Class of 2028): 65,612; Total Accepted: 5,139
- Average Unweighted GPA: Estimated 4.15
- Middle 50% SAT Composite: 1480-1550
- Middle 50% ACT Composite: 33-35
Cornell, most difficult colleges to get into and an Ivy League university, maintains a competitive admissions process with fluctuating acceptance rates, signalling a trend of growing selectivity. It also attracts a significant early decision applicant pool. Cornell consistently receives an exceptionally high volume of applications, with over 65,000 for the Class of 2028. This places it among the most applied-to institutions, even with an acceptance rate that is comparatively higher than some of its Ivy League peers.
Rice University
- Overall Acceptance Rate: 7.75% (Class of 2029)
- Total Applicants (Class of 2029): 36,777; Total Accepted: 2,852
- Average Unweighted GPA: Estimated 4.17
- Middle 50% SAT Composite: 1500-1560
- Middle 50% ACT Composite: 34-35
Rice University has the lowest college acceptance rate, has experienced a surge in applications, with its acceptance rate fluctuating around 8% in recent years. The institution also highlights the increasing importance of early decision rounds in its admissions process. Rice University’s strong selectivity (7.75% for Class of 2029) and a significant increase in applicant volume (a record 36,777) suggest its rising national profile beyond its traditional strength as a top Southern institution.
Amherst College
- Overall Acceptance Rate: 9% (Class of 2028)
- Total Applicants (Class of 2028): 13,743; Total Accepted: 1,238
- Average Unweighted GPA: Estimated 4.1
- Middle 50% SAT Composite: 1480-1550
- Middle 50% ACT Composite: 33-35
Amherst is hardest universities to get into. It is a highly selective liberal arts institution distinguished by its need-blind admissions policy, which aims to ensure access for students from all financial backgrounds. This policy signifies that an applicant’s financial need does not influence the admission decision. This, coupled with a high percentage of students receiving financial aid (nearly 60%), likely attracts a highly diverse and talented applicant pool from all socioeconomic backgrounds.
Another 10 Competitive Colleges with Lowest Admission Rate
Beyond the 20 hardest universities to get into mentioned above, this article also introduces 10 additional institutions. While not as renowned as those top 20, they are equally outstanding universities with extremely low acceptance rates.
Rank | College Name | Acceptance Rate | SAT Range |
21 | Colby College | 7.6% | 1430-1540 |
22 | Williams College | 8.5% | 1480-1570 |
23 | University of California-Los Angeles Test Blind | 8.6% | text blind |
24 | Geogetown University | 12.0% | 1430-1550 |
25 | Barnard College | 8.8% | 1440-1550 |
26 | Bowdoin College | 9.2% | 1460-1560 |
27 | Tufts University | 9.7% | 1450-1550 |
28 | Claremont McKenna College | 10.4% | 1440-1550 |
29 | Grinnell College | 10.6% | 1380-1530 |
30 | Carnegie Mellon University | 11.3% | 1490-1570 |
What Makes a College Hardest Schools to Get into?
We can examine the reasons for a university’s hardest to get into from three perspectives: acceptance rate, median SAT score, and median ACT score. To build a reputation for excellence, top universities always adhere to strict admission standards. They have established an academic standard that is much higher than that of ordinary institutions by carefully selecting only the best students. These universities tend to have a strong reputation, and their graduates are highly sought after in the job market. To select the most difficult universities in the United States to apply to, we evaluated universities based on the latest data from the Integrated Higher Education Data System (IPEDS) for the 2023-2024 academic year, based on the following three core indicators:
- Acceptance rate — the percentage of applicants they accept
- Median SAT score of accepted students — combining math and evidence-based reading and writing components
- Median ACT score
5 Tips for Getting into a University with Lowest Acceptance Rate
This article also provides some helpful tips to make it easier for you to gain admission to these colleges with the lowest admission rates, and we hope you find them useful.
- Depth Over Breadth in Activities
Focus on 1-2 meaningful extracurriculars where you demonstrate leadership and impact. Quality and commitment matter more than a long list of superficial involvements. - Academic Excellence
Aim for a near-perfect GPA while challenging yourself with rigorous courses like AP or IB. Strong grades in difficult classes signal your readiness for top-tier academics. - Authentic Essays
Write personally and thoughtfully. Share real stories that reflect your character and perspective. Avoid AI-generated content—authenticity stands out. - Build Strong Recommender Relationships
Cultivate genuine connections with teachers who can describe your strengths in detail through specific examples. Start early and choose recommenders who know you well. - Excel in Standardised Tests
Prepare thoroughly to achieve top SAT/ACT scores. High results strengthen your application and align with the expectations of selective universities.
Conclusion about Hardest College to Get into
This article primarily introduces the top 20 hardest colleges to get into worldwide. Besides, in navigating the landscape of the most selective U.S. universities, a clear picture emerges: gaining admission demands more than just stellar grades. The consistently low acceptance rates, driven by surging applicant pools and holistic review processes, highlight the intense competition. While quantitative metrics provide a baseline, elite institutions prioritise intellectual curiosity, meaningful engagement, and a compelling personal narrative. Strategic application, including early decision where appropriate, and a deep understanding of each institution’s unique values are crucial. Ultimately, the journey to these hardest colleges to get into is not just about numbers, but about showcasing your distinct potential and finding the best fit for your aspirations.
FAQs about Hardest Colleges to Get into
What is the #1 hardest college to get into?
Harvard University is currently ranked the hardest college to get into, with an acceptance rate of approximately 3.2%. This extreme selectivity is due to its immense prestige, vast resources, and a deeply competitive applicant pool of the world’s top students, all vying for a limited number of spots.
Which UK university is hardest to get into?
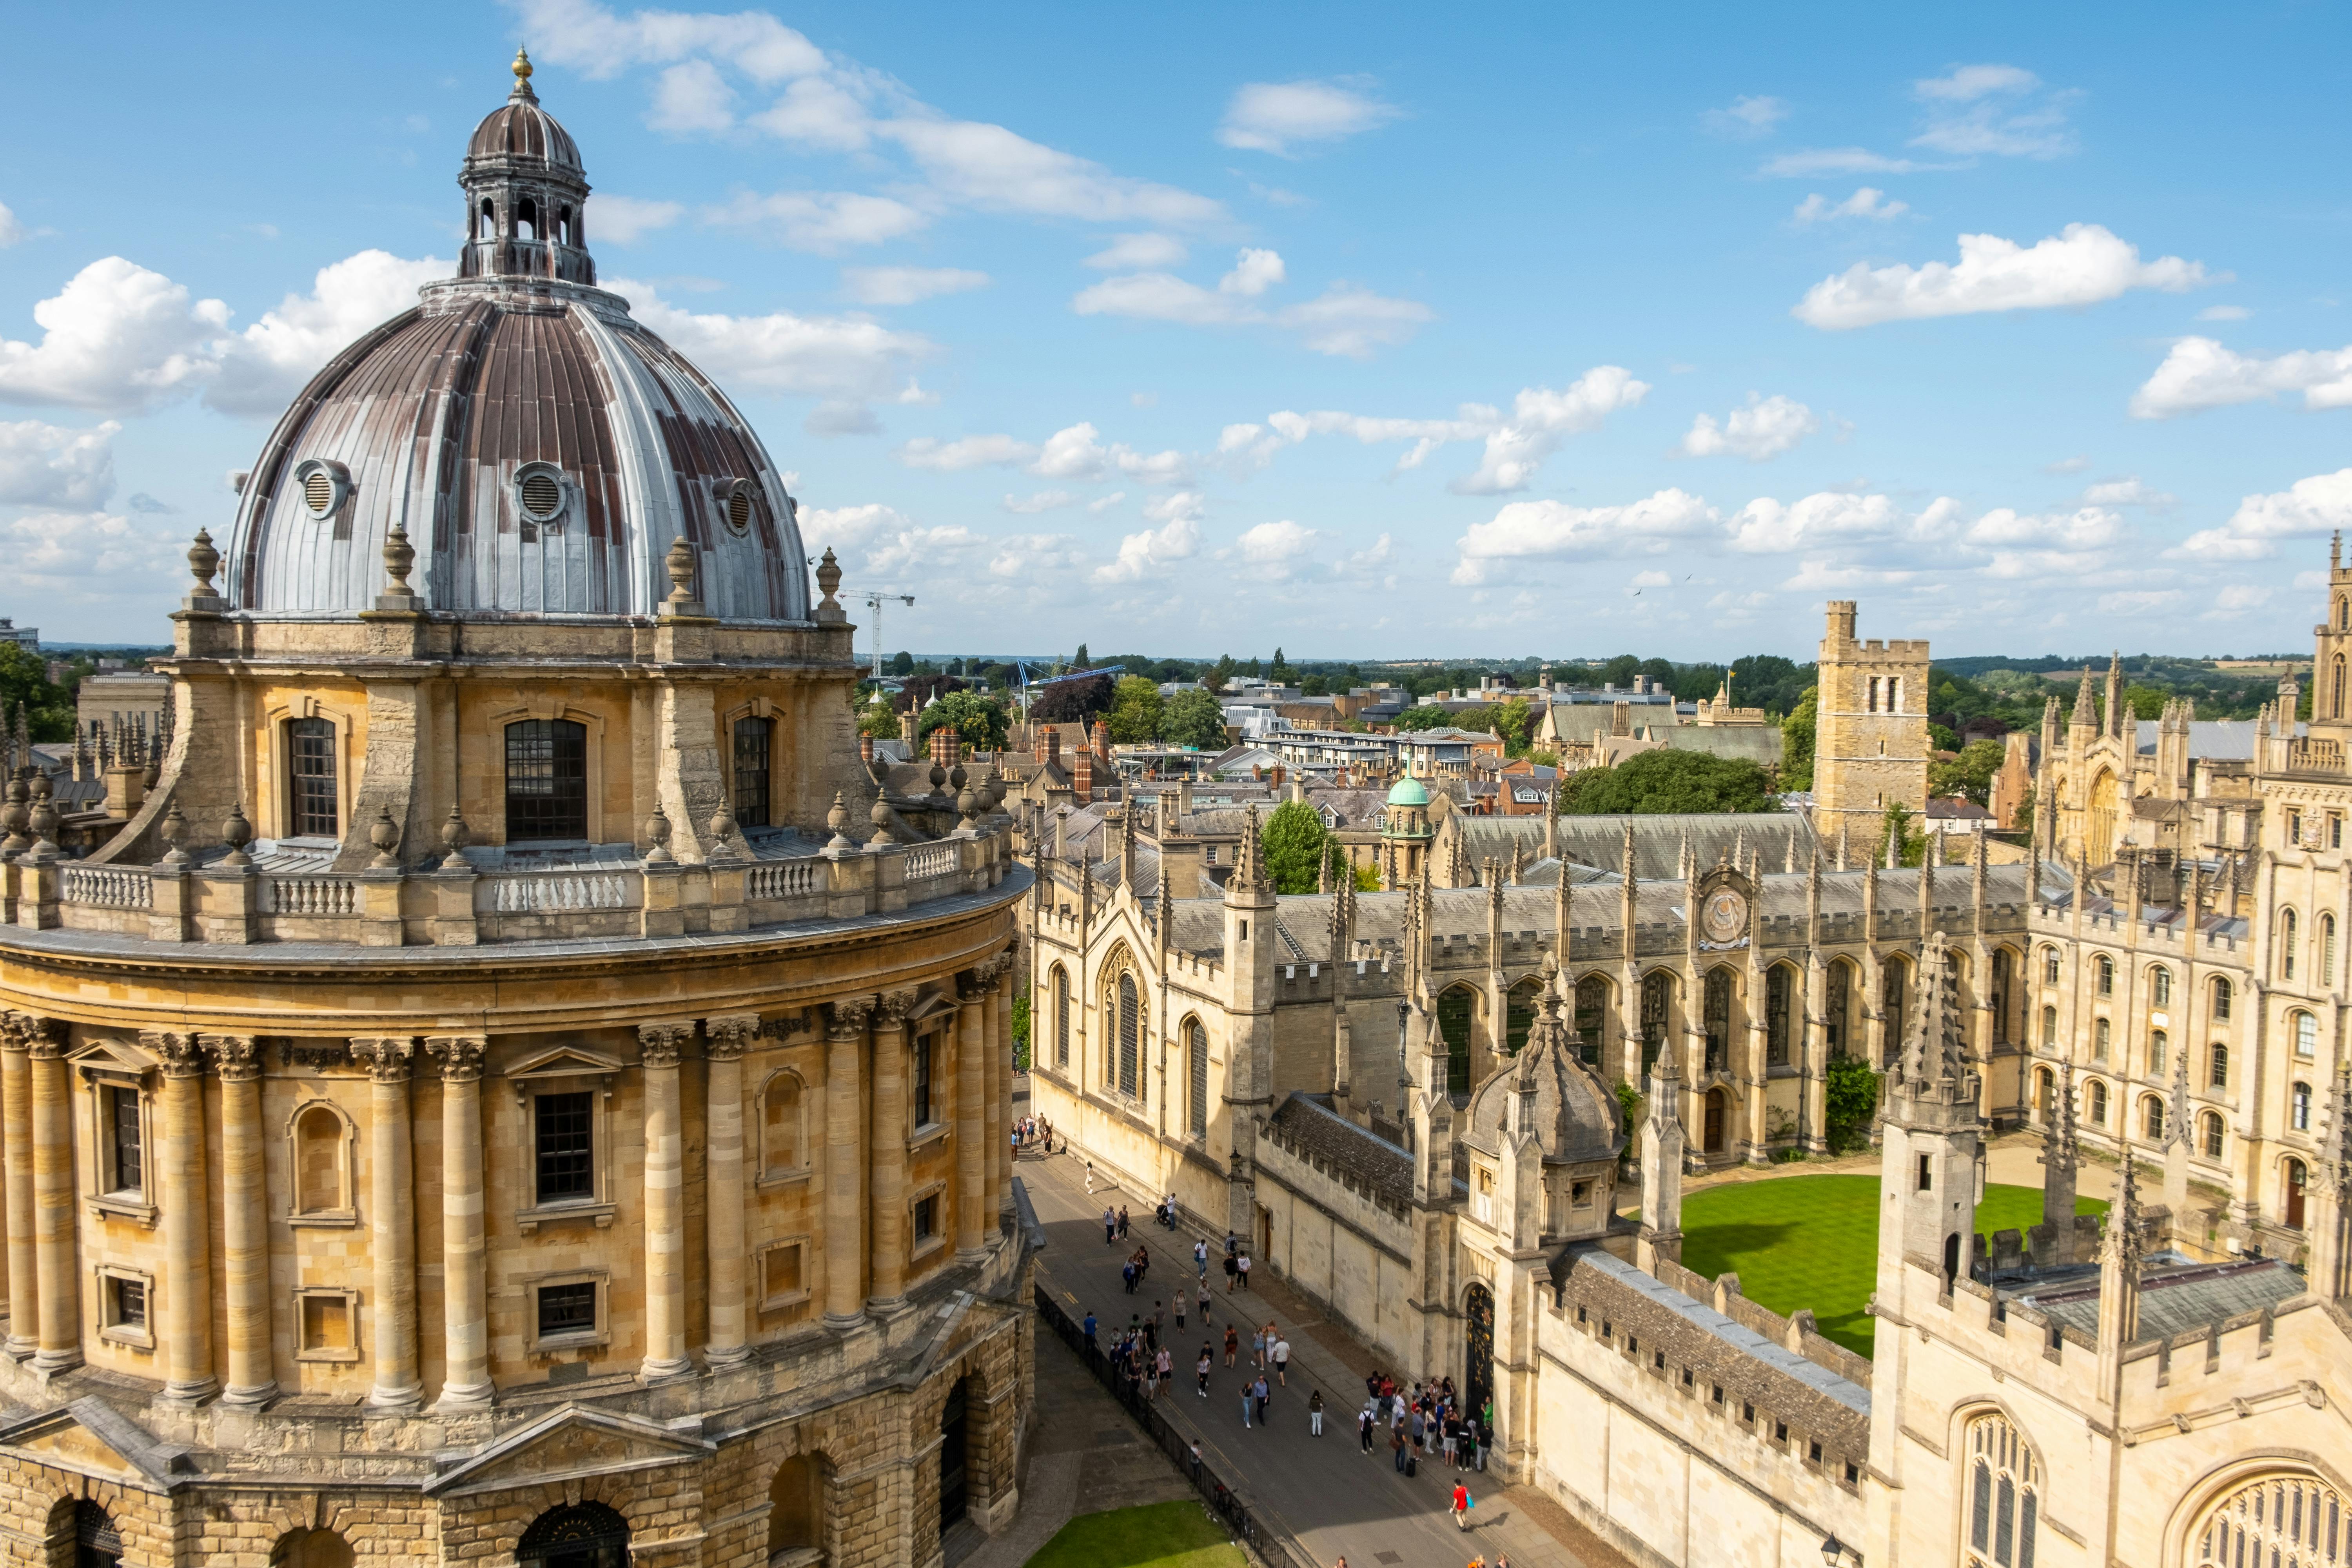
The University of Oxford is statistically the hardest UK university to get into for undergraduate study. While acceptance rates vary by course, the overall rate is around 14%, with many prestigious programs like Medicine being far more competitive, requiring perfect grades and exceptional performance in interviews and admissions tests.
Is a 3% acceptance rate low?
Yes, a 3% acceptance rate is exceptionally low. It signifies an institution of extreme selectivity where the vast majority of highly qualified applicants are rejected. For context, the average US college acceptance rate is around 70%. A 3% rate is a hallmark of the world’s most elite and competitive universities.


