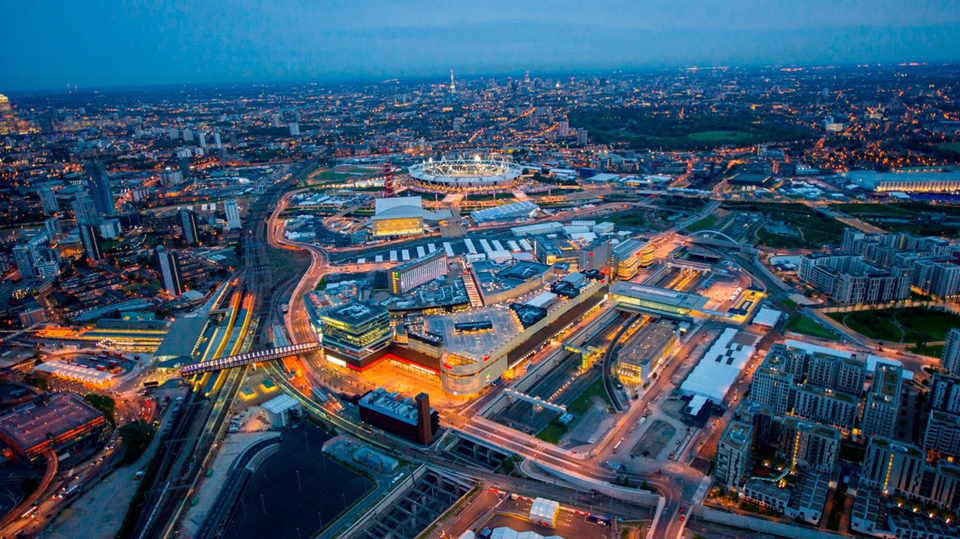
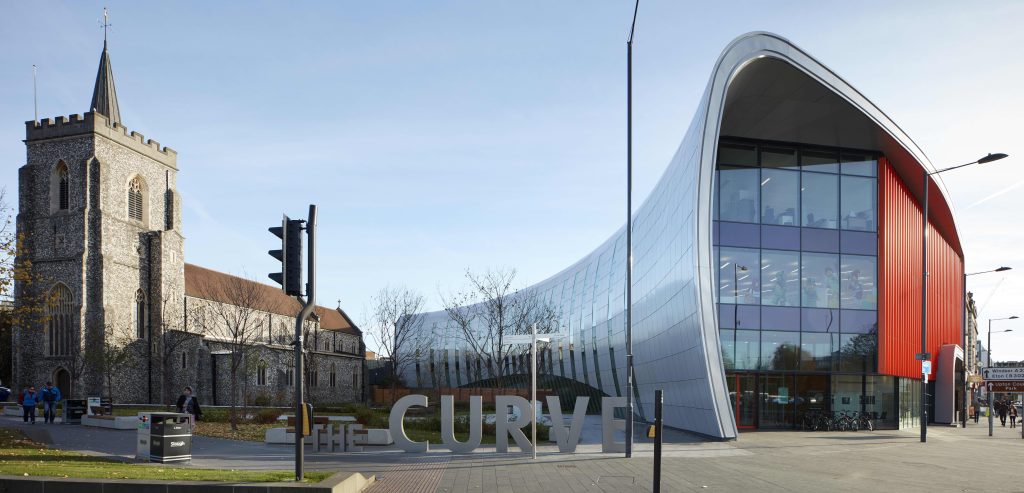
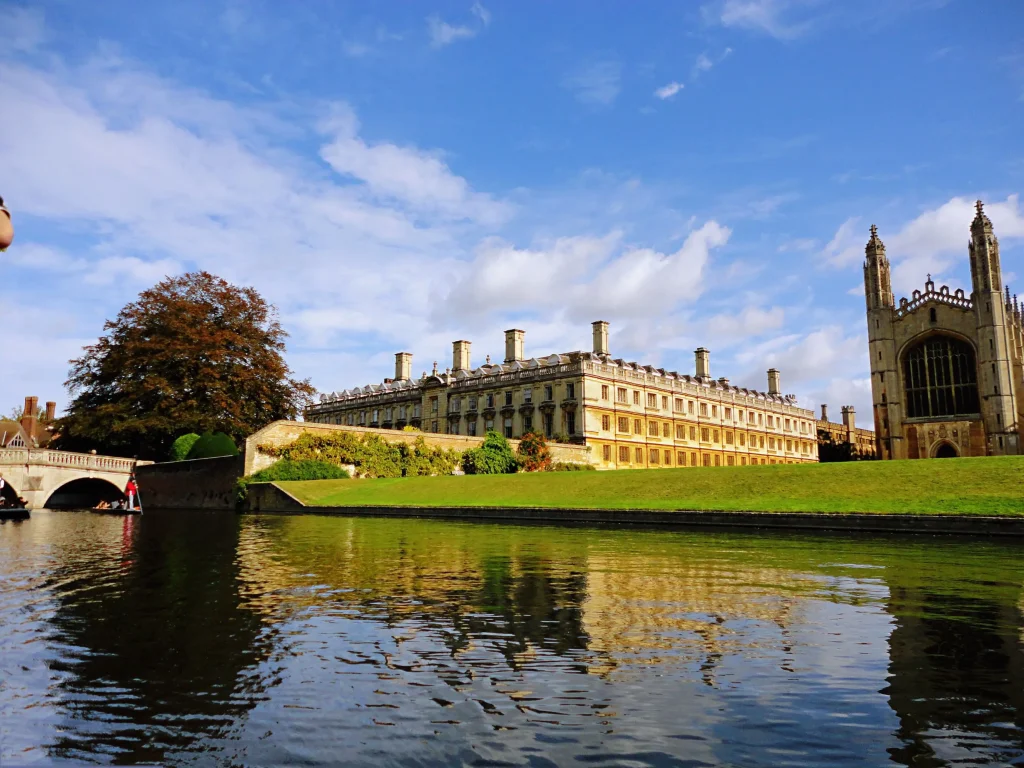
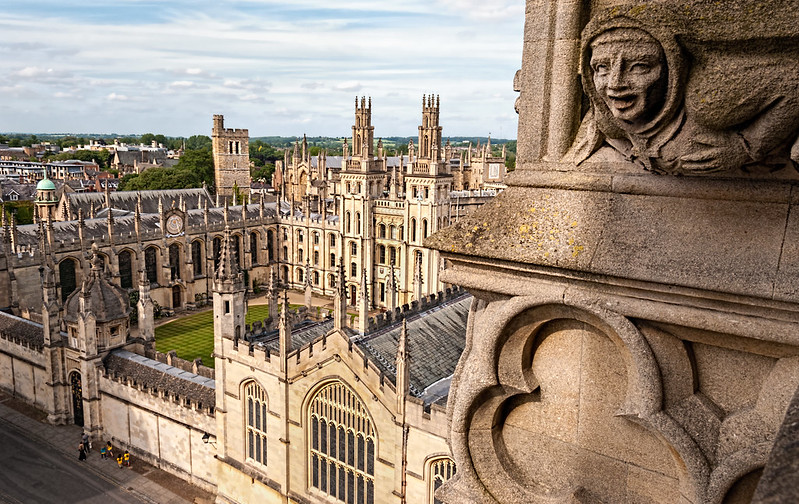
Many wonder which UK areas have the most migrants. Here, we introduce the Top 10 areas with highest proportion of non-UK born residents. We’ve also included a complete list of the Top 50 Areas with the highest proportion of migrants in the UK at the end of this post. We hope you find it helpful!
If you’re thinking about studying in the UK, it’s crucial to find the right student accommodation. That’s where uhomes comes in. It’s a reliable platform that helps students like you find the perfect place to live in London, Manchester, Nottingham, Newcastle, Leeds and many other cities.
![https://en.uhomes.com/?xcode=000a074e21616c69f658](https://pic.uhomes.com/onlineblog/cdn/uploads/2023/07/uhomescom.png)
London
London undeniably leads the UK in terms of the highest proportion of migrants, boasting the largest immigrant population among all regions.
Migrants tend to gravitate towards specific areas within the UK. In 2021, approximately half of the UK’s foreign-born population, totaling 48%, resided either in London (35% – 3,346,000) or the South East (13% – 1,286,000).
Areas such as Brent, Westminster, and Kensington and Chelsea stand out for their significant immigrant populations in London. We’ve previously discussed which areas of London have most migrants in a previous post. To learn more, click here: Which Places in the London Have the Most Immigrants?.
![Newham, London](https://pic.uhomes.com/onlineblog/cdn/uploads/2024/03/2009_MAINIMAGE_0_4800480x27010_4800960x5392480_99990960x5391480_999901598x8982_1021_.jpg)
Slough
Located in Berkshire, England, Slough sits 20 miles (32 km) west of central London. With one of the most ethnically diverse populations in the United Kingdom, Slough boasts a significant proportion of migrants. Since the 1920s, the town has been a magnet for labor from across the country and around the globe, shaping it into a major trading center. According to 2021 data, 44% of its population were born outside the UK.
Slough stands out for its concentration of UK headquarters for global companies outside London. The Slough Trading Estate, the largest industrial estate in single private ownership in Europe, hosts over 17,000 jobs across 400 businesses. Notable companies such as Blackberry, McAfee, Burger King, DHL, Telefonica, and Lego have chosen Slough as the location for their head offices, cementing its status as a thriving business hub.
![slough](https://pic.uhomes.com/onlineblog/cdn/uploads/2024/03/106410138-1582703289524gettyimages-929453464-1024x493.jpeg)
Leicester
Leicester, the East Midlands‘ largest city with a 2021 population of 366,018, earned the title of the region’s best place to live and work in 2023.
Since the mid-20th century, Leicester has seen significant immigration from Commonwealth countries, shaping it into one of the Midlands’ largest and most diverse urban centers. A notable 41.1% of its population comprises non-UK born residents.
Leicester’s immigrant community has deep historical ties. The city hosts a thriving South Asian population, especially of Indian and Pakistani descent, dating back to the post-World War II era.
In recent years, Leicester has also welcomed migrants from Eastern European nations, particularly after the EU’s 2004 expansion. This influx adds to the city’s multicultural fabric, with contributions from countries like Poland, Romania, and Lithuania.
![](https://pic.uhomes.com/onlineblog/cdn/uploads/2024/03/leicester-1024x512.jpg)
Luton
Luton, located in Bedfordshire, England, boasts a population of 225,262 as per the 2021 census. With 38.4% of its residents being Non-UK Born, it has a notably diverse immigrant demographic.
The town hosts the renowned Luton International Carnival, the largest one-day carnival in Europe, held annually on the day before the last Monday in May. Additionally, the Saint Patrick’s festival, celebrating the town’s sizable Irish community, takes place on the weekend nearest to Saint Patrick’s Day. Luton also boasts a significant Pakistani community, attracted to employment opportunities, notably at the Vauxhall car plant.
![](https://pic.uhomes.com/onlineblog/cdn/uploads/2024/03/20240725014733307.jpg)
Cambridge
As of the 2021 United Kingdom census, Cambridge’s population stood at 145,700. Known for its renowned university and bustling tech scene, the city attracts a diverse mix of people, including migrants, for various reasons. Impressively, 38% of its residents were born outside the UK, adding to its cultural richness.
Cambridge’s educational prestige plays a big role in drawing people from around the world. With the University of Cambridge in its midst, the city welcomes students and academics from diverse backgrounds. Many come for temporary study or work but often end up staying, becoming part of the city’s immigrant community.
Additionally, Cambridge is a hub for research and innovation, especially in fields like biotechnology, pharmaceuticals, and software development. Skilled professionals from different countries flock here for job opportunities, adding to the city’s diverse population. Cambridge is home to multinational companies and top-notch research institutions that actively seek talent from abroad. These organizations offer jobs to people with specialized skills, making the city even more culturally vibrant.
![cambridge](https://pic.uhomes.com/onlineblog/cdn/uploads/2024/02/University-of-Cambridge-1024x768.webp)
Oxford
Oxford, with a population of 162,100 according to the 2021 census, boasts a vibrant immigrant community, constituting 35% of its residents. Similar to Cambridge, it’s famed for its esteemed university and cultural legacy, drawing migrants for diverse reasons. Oxford University’s global reputation attracts students and scholars seeking academic excellence. The city’s rich history and multicultural ambiance offer a welcoming environment for migrants from around the world.
![cost of living at the university of oxford](https://pic.uhomes.com/onlineblog/cdn/uploads/2023/11/Oxford-University_All-Souls-College.jpg)
Watford
Watford, located in Hertfordshire, England, 15 mi (24 km) north-west of Central London, boasts a diverse population where 34% are non-UK born residents.
Situated just northwest of London, the city benefits from its close proximity to the UK’s capital city. Many migrants are drawn to Watford as an alternative to living directly in London, offering a more affordable cost of living while still providing convenient access to the opportunities and amenities of a major metropolitan area.
Additionally, Watford boasts a diverse economy with opportunities in sectors such as retail, healthcare, finance, and technology, making it an attractive destination for migrants seeking employment opportunities and economic stability.
![watford, uk](https://pic.uhomes.com/onlineblog/cdn/uploads/2024/03/18fa28b84036c978a92104fbc2d95b1a-1024x680.webp)
Reading
Nestled in Berkshire, England, Reading stands out as a magnet for migrants, with 33.5% of its population being non-UK born residents in 2021.
The city’s allure lies in its rich diversity, with a vibrant cultural scene boasting festivals, cuisines, and community events that honor a plethora of traditions. Remarkably, Reading hosts an impressive array of 150 spoken languages, a testament to its cosmopolitan ambiance. Reading also has a thriving Polish community, with roots tracing back over three decades.
![](https://pic.uhomes.com/onlineblog/cdn/uploads/2024/03/4_HFR_BRK_300320_Reading_02jpeg.webp)
Manchester
Manchester boasts a significant immigrant population, with 31.4% of its residents being non-UK born. Ethnically, the City of Manchester stands out with the highest non-white proportion of any district in Greater Manchester. Moss Side, Longsight, Cheetham Hill, and Rusholme are identified by experts as hubs for ethnic minorities.
Manchester’s vibrant cultural scene is further enriched by its renowned Irish Festival, featuring a grand St. Patrick’s Day parade, which ranks among Europe’s largest.
Adding to the city’s multicultural flair is its well-established Chinatown, characterized by numerous Chinese restaurants and supermarkets. Notably, Manchester also attracts a substantial number of Chinese students to its universities, contributing to its status as the third-largest Chinese population hub in Europe.
![find out the best place to live in manchester city](https://pic.uhomes.com/onlineblog/cdn/uploads/2024/03/Manchester-Eng-1024x675.webp)
Peterborough
Located in the City of Peterborough district of Cambridgeshire, England, Peterborough is a cathedral city. It has a substantial immigrant population, with 28.2% of its residents born outside the UK.
Peterborough stands out for its diverse cultural makeup. It is home to one of the largest concentrations of Italian immigrants in the UK. This can be traced back to labor recruitment efforts in the 1950s by the London Brick Company in southern Italian regions. In 1996, the Italian community in Peterborough numbered 7,000, making it the third largest in the UK after London and Bedford.
During the late twentieth century, immigration to Peterborough primarily came from new Commonwealth countries. Between 2001 and 2011, a total of 24,166 migrants moved to the city. Significant immigration from the A8 countries that joined the European Union in 2004 has also been observed. In 2011, 14,134 residents were born in Central and Eastern Europe.
![](https://pic.uhomes.com/onlineblog/cdn/uploads/2024/03/Peterborough-1024x576.jpg)
UK Migrants - FAQ
What attracts migrants to the UK?
Migrants are attracted to the UK for various reasons, including job opportunities, educational prospects, cultural diversity, political stability, and access to healthcare and social services.
Why do migrants prefer UK over France?
Migrants may prefer the UK over France due to factors such as language proficiency, existing social connections, familiarity with the UK, historical ties, and perceptions of better treatment for immigrants.
How many migrants are there in the UK?
Approximately 1.18 million individuals immigrated to the UK, with 508,000 emigrating, resulting in a net migration of 672,000 in the 12 months leading up to June 2023. The Office for National Statistics (ONS) estimated a net migration of 745,000 in 2022, significantly surpassing the pre-pandemic figure of 184,000 in 2019.
How many illegal migrants are there in the UK?
According to various studies, the estimated number of illegal migrants in the UK ranges from 417,000 to 863,000. Among them, there is a population of UK-born children estimated to be between 44,000 and 144,000. A study conducted by the University of Oxford in 2011 estimated that there were around 120,000 illegal migrant children, with over half of them born in the UK to parents without legal immigration status. In 2020, an updated study funded by the Greater London Authority and conducted by researchers at the University of Wolverhampton’s Institute for Community Research and Development estimated that the figure in April 2017 was between 594,000 and 745,000, including between 191,000 and 241,000 children.
What factors contribute to more migrants in certain UK areas?
Factors such as job opportunities, cultural diversity, existing immigrant communities, and historical ties play a role in attracting immigrants to specific areas.
How does the immigrant population in the UK compare to other countries?
The UK has a significant immigrant population but ranks lower in terms of proportion compared to countries like Canada, Australia, and the United States.
Areas with Highest Proportion of Migrants in the UK (Top 50)
No. | LA name | Non-UK Born Residents, 2011 (%) |
Non-UK Born Residents, 2021 (%) |
1 | Brent | 55.1 | 56.1 |
2 | Westminster | 53.3 | 55.6 |
3 | Kensington and Chelsea | 51.6 | 53.9 |
4 | Newham | 53.7 | 53.7 |
5 | Harrow | 44.8 | 51.1 |
6 | Ealing | 48.2 | 50.8 |
7 | City of London | 36.7 | 49.6 |
8 | Hounslow | 43.3 | 49.5 |
9 | Tower Hamlets | 43.1 | 46.8 |
10 | Haringey | 44.6 | 45.8 |
11 | Hammersmith and Fulham | 42.8 | 45.5 |
12 | Camden | 42.5 | 45.4 |
13 | Slough | 39.0 | 44.0 |
14 | Redbridge | 36.9 | 43.6 |
15 | Barnet | 38.9 | 43.2 |
16 | Barking and Dagenham | 30.9 | 41.3 |
17 | Leicester | 33.6 | 41.1 |
18 | Merton | 37.8 | 40.9 |
19 | Southwark | 39.4 | 40.7 |
20 | Enfield | 35.1 | 40.4 |
21 | Islington | 35.4 | 39.9 |
22 | Hackney | 39.1 | 39.7 |
23 | Lambeth | 38.9 | 38.6 |
24 | Waltham Forest | 38.6 | 38.6 |
25 | Hillingdon | 30.0 | 38.5 |
26 | Luton | 30.9 | 38.4 |
27 | Cambridge | 29.4 | 38.0 |
28 | Wandsworth | 35.4 | 37.9 |
29 | Greenwich | 31.0 | 37.5 |
30 | Lewisham | 33.7 | 35.6 |
31 | Oxford | 28.5 | 35.0 |
32 | Croydon | 29.6 | 34.9 |
33 | Watford | 24.7 | 34.0 |
34 | Kingston upon Thames | 28.3 | 33.7 |
35 | Reading | 24.8 | 33.5 |
36 | Manchester | 25.3 | 31.4 |
37 | Richmond upon Thames | 24.3 | 28.8 |
38 | Peterborough | 20.6 | 28.2 |
39 | Coventry | 21.2 | 27.9 |
40 | Sutton | 19.9 | 27.8 |
41 | Crawley | 20.3 | 26.8 |
42 | Birmingham | 22.2 | 26.7 |
43 | Milton Keynes | 18.5 | 25.7 |
44 | Nottingham | 19.5 | 24.6 |
45 | Woking | 19.9 | 24.2 |
46 | Southampton | 17.6 | 24.1 |
47 | Rushmoor | 17.6 | 23.8 |
48 | Boston | 15.1 | 23.6 |
49 | Sandwell | 15.9 | 23.6 |
50 | Hertsmere | 17.0 | 22.9 |